package require BLT namespace import blt::* # ベクタ x を生成 (0〜9) vector create x(10) => ::x # ベクタ y を生成 (0〜9) vector y(10) => ::y # ベクタ z を生成 (1〜10) vector y(1:10) => ::z |
ベクタの廃棄はvector destroyを使います。
# ベクタ x y zの破棄 vector destroy x y z |
ベクタの各要素は、添え字(0〜n)使って配列のようにアクセスします。
添え字にendを使うと最終要素を指定できます。
また、コロン(:)を使うと要素の範囲を指定できます。
# ベクタの初期化
foreach i {0 1 2 3 4 5 6 7 8 9} {
set x($i) $i
}
# 最初の要素
puts $x(0)
=> 0.0
# 最後の要素
puts $x(end)
=> 0.9
# 0〜3の範囲の要素
puts $x(0:3)
=> 0.0 0.1 0.2 0.3
# すべての要素
puts $x(:)
=> 0.0 1.0 2.0 3.0 4.0 5.0 6.0 7.0 8.0 9.0
# 1+2の要素
=> puts $x(1+2)
=> 3.0
|
添え字にmin, max, meanを使うと最小値、最大値、平均値を求めることができます。
# ベクタの初期化
foreach i {0 1 2 3 4 5 6 7 8 9} {
   set x($i) $i
}
# 最小
puts $x(min)
=> 0.0
# 最大
puts $x(max)
=> 9.0
# 平均
puts $x(mean)
=> 4.5
|
動的なベクタも生成できます。ベクタ生成時に要素の数を指定しません。
++endを使って動的に要素を割り当てます。
# 動的なベクタ d を生成
vector d
# ベクタの初期化
foreach i {0 1 2 3 4 5 6 7 8 9} {
    set d(++end) $i
}
# すべての要素
puts $d(:)
=> 0.0 1.0 2.0 3.0 4.0 5.0 6.0 7.0 8.0 9.0
|
ベクタを生成するとコマンドとしても機能します。
# ベクタ z を生成する
vector z
# 要素を初期化する
z set {9 8 7 6 5 4 3 2 1 0}
# 要素数を調べる
z length
=> 10
# 要素を昇順または降順にソートする
z sort
z sort -reverse
# 範囲の要素を返す
z range 0 end
=> 0.0 1.0 2.0 3.0 4.0 5.0 6.0 7.0 8.0 9.0
# 検索した要素の添え字を返す
z search 5.0
=> 5
# 要素を追加する
z append {10.0 11.0}
# すべての要素に1.0を加算する
z expr { z + 1}
# -5〜5まで1刻みで要素に設定する
z seq -5 5 1
# ノーマライズする
z normalize
# データを補完する
z populate z2 10
# 複製する
z dup zz
# 要素を削除する
z delete 1 2
# 要素をマージする
z merge v1 v2
# 乱数を設定する
z random
# 要素をシフトする
z offset -1
# ベクタをTcl配列にマッピングする
z variable ary
|
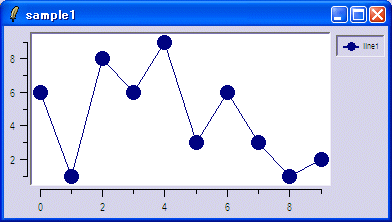
package require BLT
namespace import blt::*

vector x y
x set {0 1 2 3 4 5 6 7 8 9}
y set {6 1 8 6 9 3 6 3 1 2}

pack [graph .graph -width 4i -height 3i] -fill both -expand 1

.graph element create line1 -xdata x -ydata y
|
ベクタを使わない方法もあります。ベクタの代わりにリストを使います。
package require BLT
namespace import blt::*

set x {0 1 2 3 4 5 6 7 8 9}
set y {6 1 8 6 9 3 6 3 1 2}

pack [graph .graph -width 4i -height 2i] -fill both -expand 1

.graph element create line1 -xdata $x -ydata $y
|
ベクタを使わないもう1つの方法です。x軸とy軸のデータを一緒に指定します。
package require BLT
namespace import blt::*

set xy {0 6 1 1 2 8 3 6 4 9 5 3 6 6 7 3 8 1 9 2}

pack [graph .graph -width 4i -height 2i] -fill both -expand 1

.graph element create line1 -data $xy
|
次のサンプルはリソースで飾りつけをしました。
グラフの拡大/縮小にも対応できます。
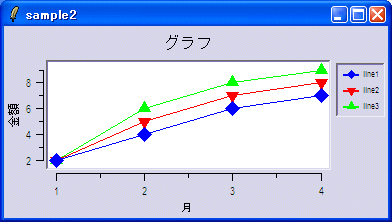
package require BLT
namespace import blt::*

option add *graph.line1.Color blue
option add *graph.line2.Color red
option add *graph.line3.Color green
option add *graph.line1.Symbol diamond
option add *graph.line2.Symbol arrow
option add *graph.line3.Symbol triangle
option add *graph.activeLine.Color yellow
option add *graph.activeLine.Symbol circle
option add *graph.Legend.ActiveBackground yellow
option add *graph.Title グラフ
option add *graph.x.Title 月
option add *graph.y.Title 金額
option add *graph.Axis.TitleFont {{MS ゴシック} 10}

pack [graph .graph -width 4i -height 2i] -fill both -expand 1
.graph element create line1 -data { 1 2 2 4 3 6 4 7}
.graph element create line2 -data { 1 2 2 5 3 7 4 8}
.graph element create line3 -data { 1 2 2 6 3 8 4 9}

Blt_ZoomStack .graph
#Blt_Crosshairs .graph
Blt_ActiveLegend .graph
Blt_ClosestPoint .graph

.graph element bind all <Enter> {
    %W legend activate [%W element get current]
}

.graph element bind all <Leave> {
    %W legend deactivate [%W element get current]
}
|
データを動的に追加して、グラフを更新するサンプルです。
最後にスプライン曲線に変換しています。
package require BLT
namespace import blt::*

option add *graph.normal.Color blue
#option add *graph.normal.Symbol cross
option add *graph.normal.Symbol ""
option add *graph.spline.Color red
#option add *graph.spline.Symbol cross
option add *graph.spline.Symbol ""
option add *graph.activeLine.Color yellow
option add *graph.activeLine.Symbol circle
option add *graph.Legend.ActiveBackground yellow
option add *graph.Title グラフ
option add *graph.x.Title 時間
option add *graph.y.Title 値
option add *graph.Axis.TitleFont {{MS ゴシック} 10}

vector x y x2 y2

pack [graph .graph -width 4i -height 2i] -fill both -expand 1

.graph element create normal -xdata x -ydata y

Blt_Crosshairs .graph
Blt_ZoomStack .graph
Blt_ActiveLegend .graph
Blt_ClosestPoint .graph

.graph element bind all <Enter> {
    %W legend activate [%W element get current]
}

.graph element bind all <Leave> {
    %W legend deactivate [%W element get current]
}

for {set i 0} {$i < 10} {incr i} {
    set ::x(++end) $i
    set ::y(++end) [expr rand()*10.0]
}

# スプライン曲線変換
x populate x2 10
spline quadratic x y x2 y2
.graph element create spline -xdata x2 -ydata y2
|
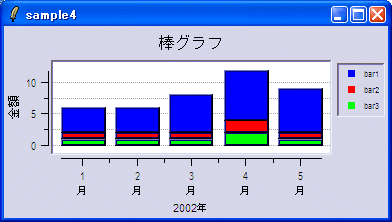
package require BLT
namespace import blt::*

option add *bc.bar1.Foreground blue
option add *bc.bar2.Foreground red
option add *bc.bar3.Foreground green
option add *bc.activeBar.Foreground yellow
#option add *bc.activeBar.Stipple pattern1
option add *bc.Legend.ActiveBackground yellow
option add *bc.Title 棒グラフ
option add *bc.x.Title 2002年
option add *bc.y.Title 金額
option add *bc.Axis.TitleFont {{MS ゴシック} 10}
option add *bc.BarMode stacked
option add *bc.x.Command FormatLabel
#option add *bc.x.Rotate 90

proc FormatLabel { w value } {

    # Determine the element name from the value

    set index [expr round($value)]
    if { $index != $value } {
        return $value
    }
    incr index -1

    set name [lindex { 1\n月 2\n月 3\n月 4\n月 5\n月 } $index]
    return $name
}

pack [barchart .bc -width 4i -height 2i] -fill both -expand 1
.bc element create bar1 -data { 1 4 2 4 3 6 4 8 5 7}
.bc element create bar2 -data { 1 1 2 1 3 1 4 2 5 1}
.bc element create bar3 -data { 1 1 2 1 3 1 4 2 5 1}

Blt_ZoomStack .bc
#Blt_Crosshairs .bc
Blt_ActiveLegend .bc
Blt_ClosestPoint .bc

.bc element bind all <Enter> {
    %W legend activate [%W element get current]
}

.bc element bind all <Leave> {
    %W legend deactivate [%W element get current]
}
|